A lot of running a successful site comes down to collecting, interpreting, and using data. Many people already use Google Analytics, Google Search Console, and Google Site Kit. But there is a new tool on the block, Google Data Studio.
I keep hearing good things about it, so let’s go ahead to see what it can do for us? So, if you are as curious as I am, let’s move on ahead.
What is Google Data Studio?
Alright, the first thing we both probably want to know is, what is this Google Data Studio everyone keeps mentioning? Let’s examine that first.
A Data Analysis Tool
In short, GDS (as we will call it from now on) is a tool to report and visualize information. It allows you to track KPIs (key performance indicators) from many different sources, combine them into reports, and generate them automatically at a time of your choosing.
This is similar to the Google Analytics custom dashboards, however, GDS can pull information from more than one place. In addition to that, it’s user friendly, comes with drag-and-drop capabilities, and easily connects to other Google services. It also makes it easy to share your reports with others.
Main Features
As already mentioned, what makes GDS so useful is that it can combine information from many places. It can pull in information from Google Analytics, Adwords, Google Sheets, MySQL, YouTube – to name just a few.
It also allows you to display data in any way you want. From bar graphs over pie charts to numbers, line graphs, and more. You can also include a date range to see information from only a certain time frame.
However, not only can GDS pull in data, but it’s also able to process it. The program allows you to input formulas to generate custom metrics. In addition, it has the ability to filter collected information so see only what you really need to know. Plus, it will dynamically update your data to reflect the latest information.
Finally, the tool is rounded off with collaboration possibilities that make it awesome for teams. You can easily share reports, grant specific user permissions to let others view your reports without messing with them, and more.
In short, you are able to create any report you want, for yourself, your superiors, team, clients or whoever you want to keep in the loop.
Is Google Data Studio Free to Use?
The short answer: yes. One of the best parts about this powerful suite is that, like many other Google products, it is completely free of charge. All you need is a (free) Google Account and you can get started.
While Google Data Studio used to be a part of the premium service Google Analytics 360, however, in 2016, the company released a free version and has been improving it over time.
GDS and GDPR
Of course, with data collection, these days you always have to think about user privacy. Therefore, if you are subject to GDPR (and many of us are), you should refer to the documentation to make sure you are in the clear. Always dot your i’s and cross your t’s in this regard!
How Do I Set Up Google Data Studio?
Alright, now that we have settled on the what and why, let’s get to the how. In the following, we will talk about how to set up and use GSD for your needs
1. Log in With Your Google Account
As mentioned, to use Google Data Studio, you need a Google account. If you already use products like Google Analytics or Search Console, it makes sense to connect to GDS with the same account.
With your account information in hand, head on over to the homepage. If you are not logged into Google currently, you will be asked to do so. After that, you land directly on the main dashboard. It’s really that easy!
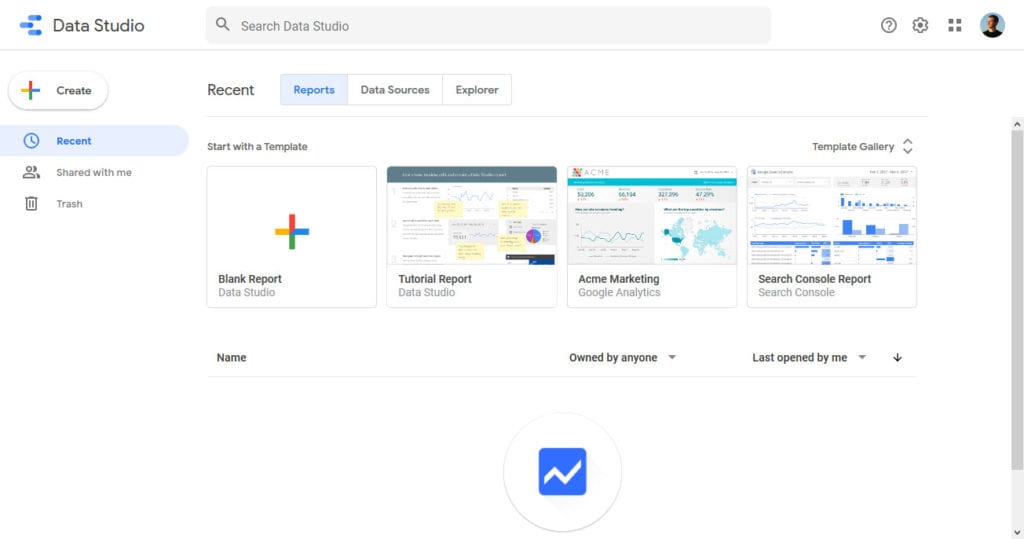
2. Explore Google Data Studio
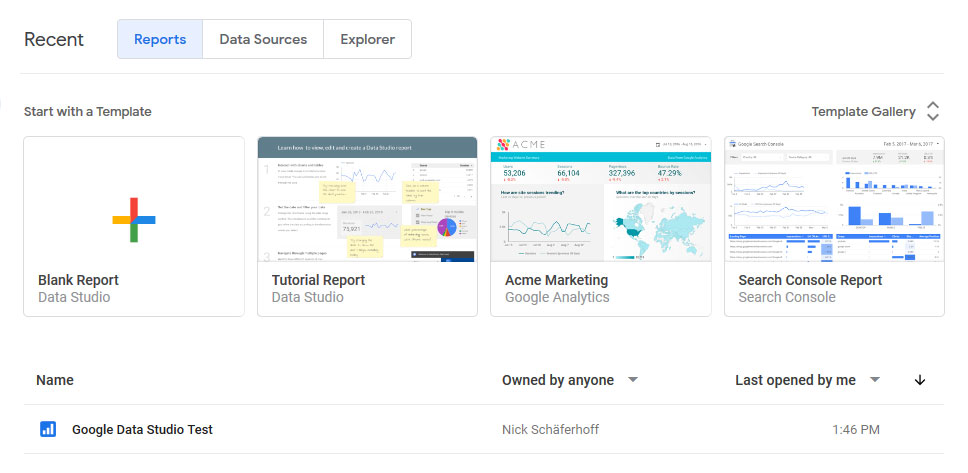
At the top, can choose between three different tabs:
- Reports — Here, you find all the data reports that you have access to or created. Choose Shared with me on the left to see those made by others.
- Data Sources — Lists all the connections you have created between information sources and Google Data Studio. Supports 500+ types of data from 190+ sources. More on that below.
- Explorer — This is a beta functionality that allows you to experiment with reports without changing them. You can import an existing report, try out some stuff, and if you like the results, export it back. If not, no harm done.
3. Add a Data Source
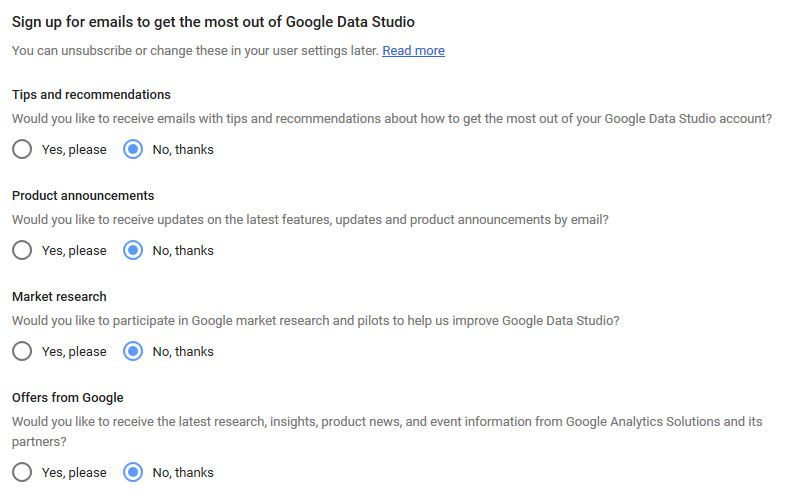
To create a report, you first need data you can import. For that, click on the big Create button in the top left corner, then choose Data Source. This will open a wizard to in which you need to accept the terms, input some information, and configure your email preferences about updates from Google.
Once that is done, you have to hit Create > Data Source one more time. Doing so will get you to this screen:
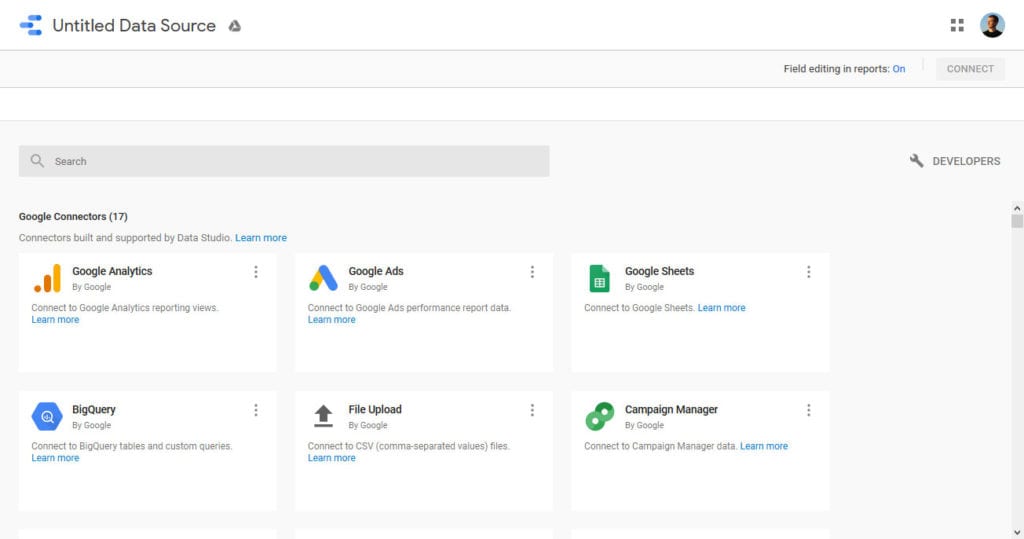
Here, you can choose from a long list of available sources what data you want to import. They range from Google services to email marketing tools, different PPC ad networks to SEO services, and more.
Use the search function on top to find if your desired source is available. If it’s not, you can still import external information via CSV, MySQL, JSON, or XML or in the form of a Google Sheet.
When you have found it (in this case, we are going with Google Analytics), hover over it and click on Select. You might have to go through an authorization process for it to work and also choose the site and view you want to import.
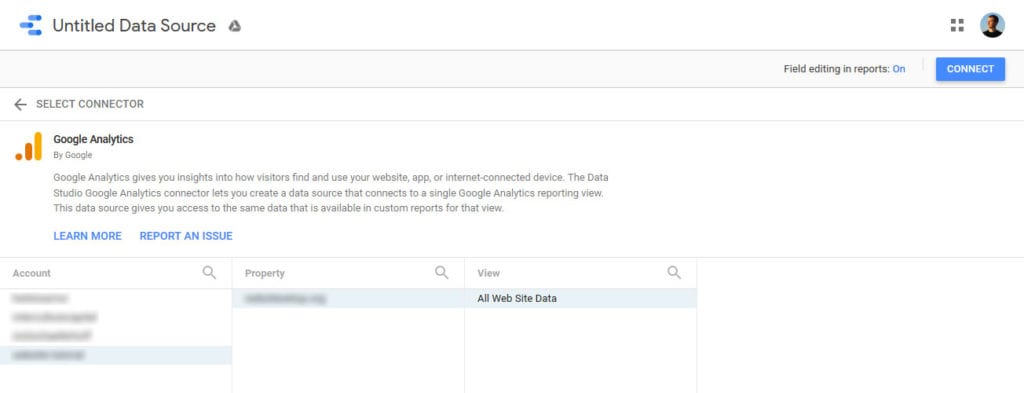
Once done, hit Connect in the upper right corner to land here:
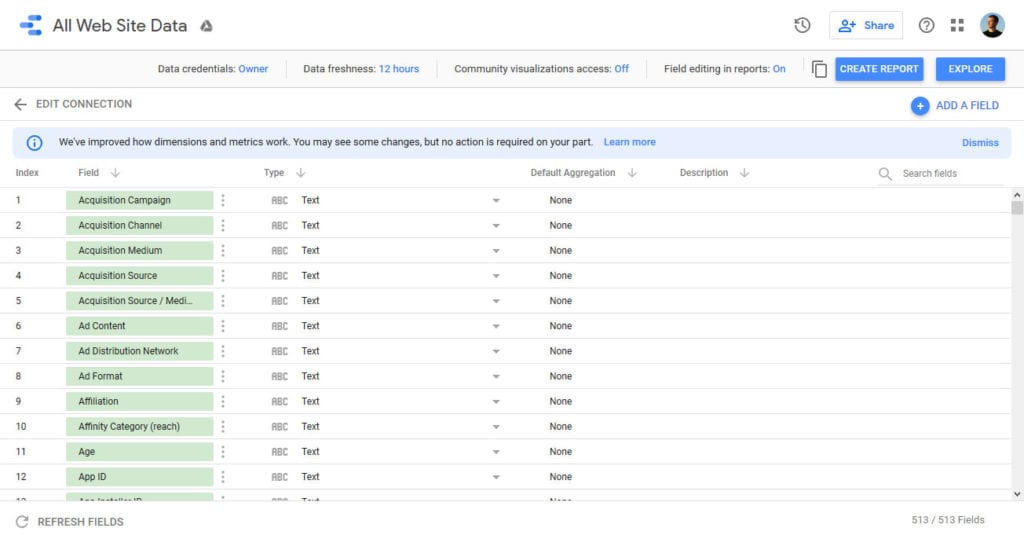
4. Start Populating Your Report
The current screen contains every field in your Analytics account. You can do a lot of things here to determine which information GDS should use, however, the easiest way is to do the configurations inside the report itself.
Therefore, simply click Create Report in the top-right corner. Google Data Studio will warn you that you are about to add data to a report to which you will answer in the affirmative and also give any needed permissions.
Then, you’ll find yourself here:
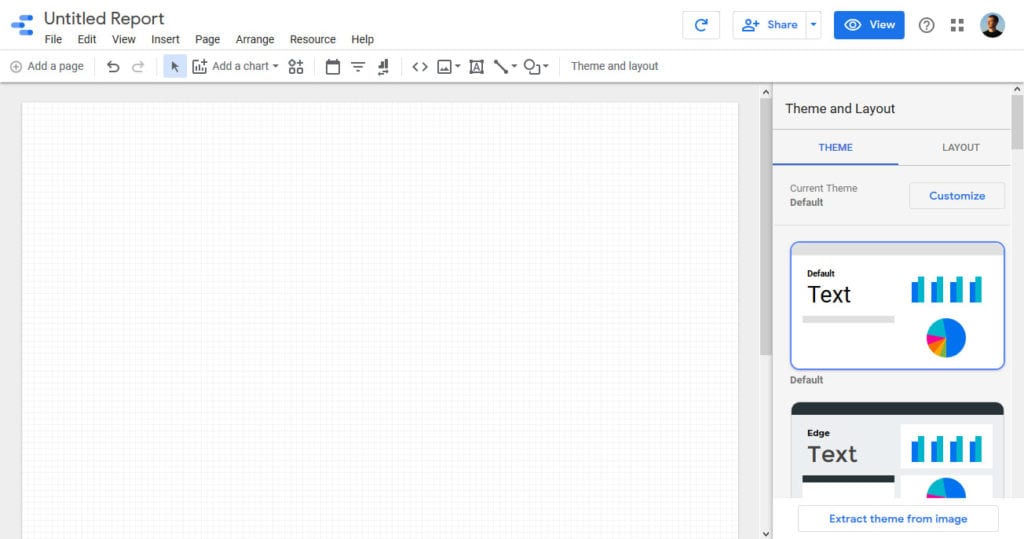
Let’s start off with the Add a chart button at the top.
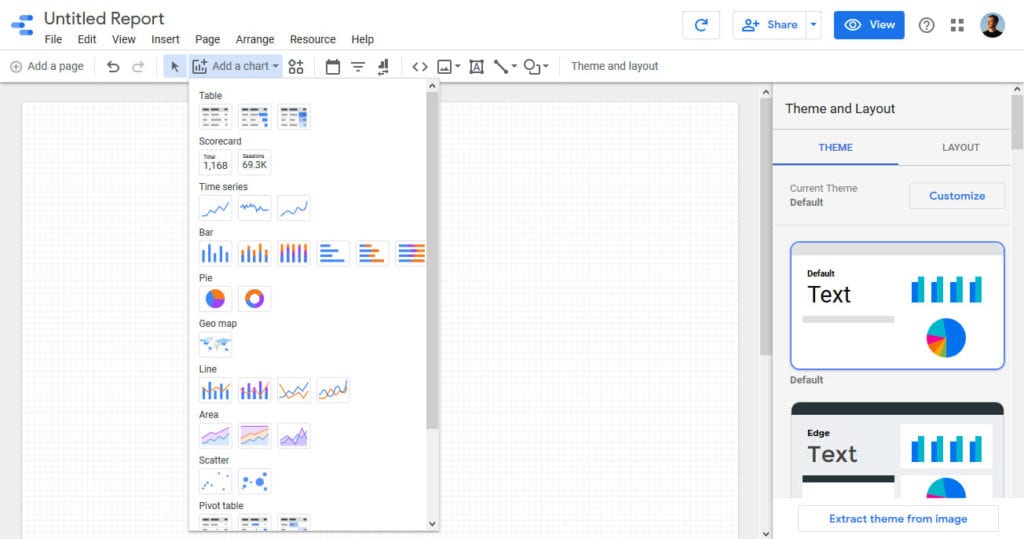
When you choose one, the first thing you need to do is place it on the canvas. You can do so either via click or drag and draw. After that, you will find options to choose the data to include on the right.
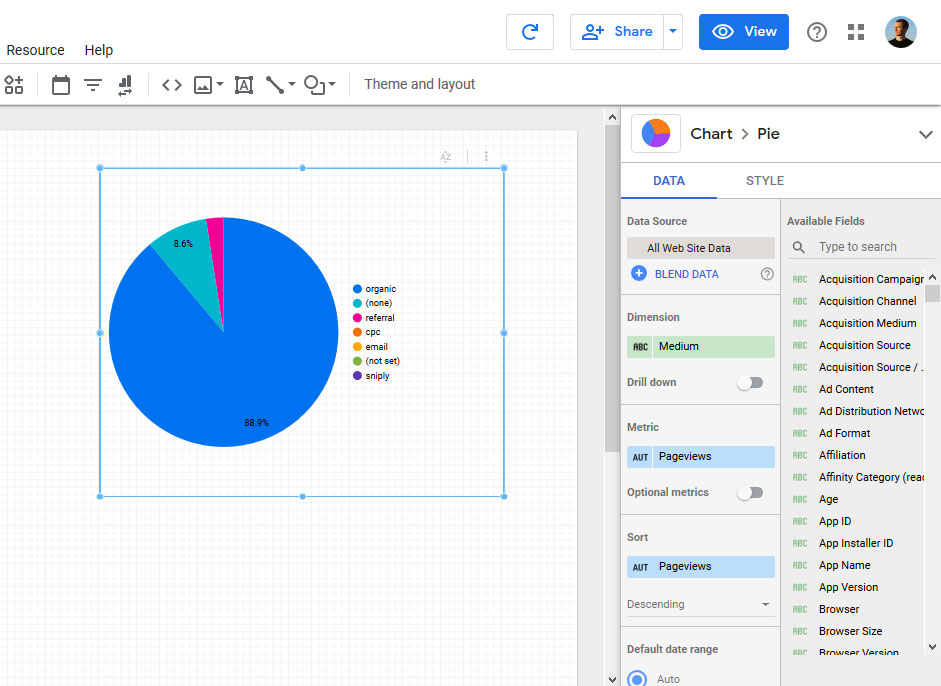
Adjust your chart dimensions and add metrics until it displays what you need it to. You are also able to delete any metric or dimension you no longer want in the same place.
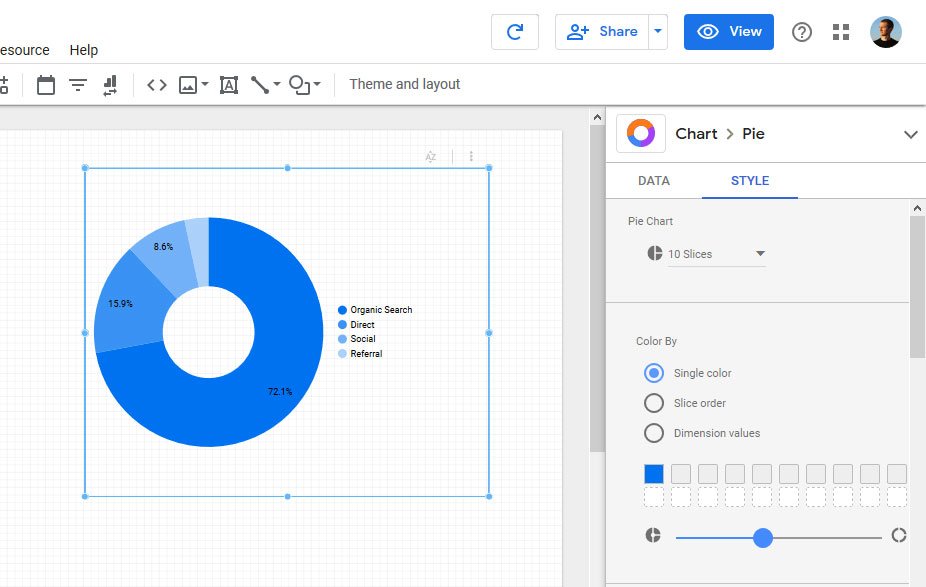
In addition, under Style you are able to make changes to the look of the chart.
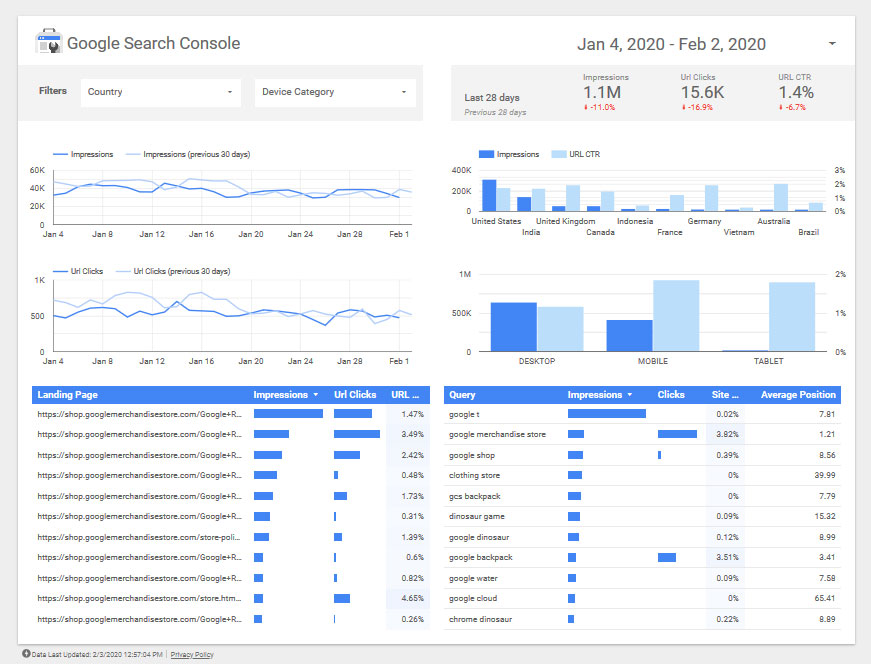
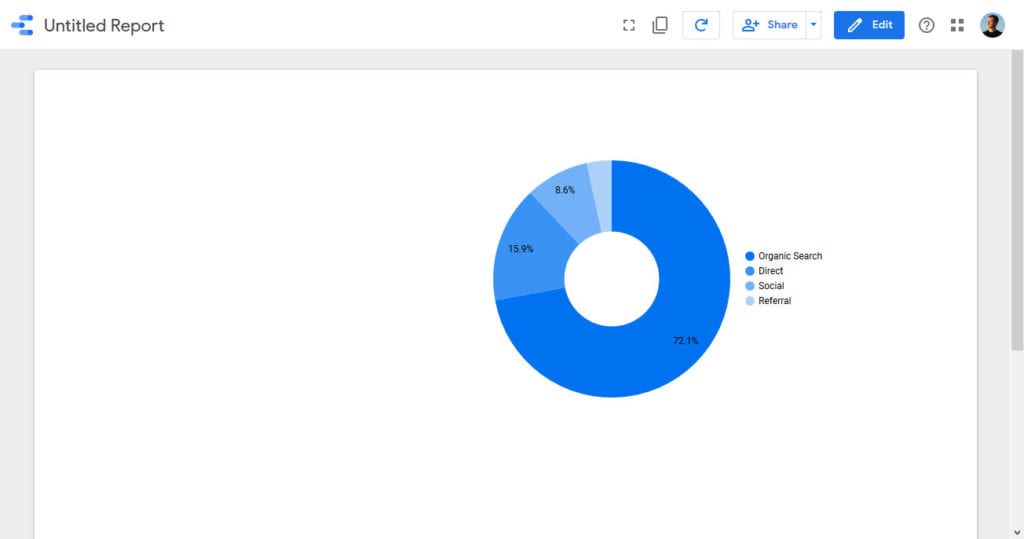
When you feel ready, click View (in the upper right corner) to see what the finished product will look like.
If you are satisfied, all that’s left is to go back to Edit and give the report a name. From now on it will appear in your Reports area.
Congratulations, you just learned the basic functionality of Google Data Studio. From here, you can start exploring the tool by yourself. However, to make it easier we will give you some tips on how to get the most out of it.
Google Data Studio Tutorial: Beginner Tips
GDS is so complex that we are unable to go over each and every part of it in this relatively short tutorial. For that reason, you find some tips below that will make working with it easier.
Decide What You Want to Track First
When using a new tool like GDS, a little planning goes a long way. If you come up with a concept first, you don’t end up measuring things you have no use for and/or creating a report that is too long and confusing.
So, before sitting down to set up your report, first think about what you really need to measure. Which KPIs do you need in order to know what’s going on and make decisions about your site? In most cases it’s best to have up to three main indicators and maybe a dozen lesser ones. This allows you to focus on what really matters and aligns the information with your goals.
For a better structure, it can also help to sketch out your report beforehand and work along that. If you are not sure, you can also use the pre-made templates mentioned below.
Use Templates
GDS comes with a lot of report templates built-in. You can find a few of them already in the dashboard, however, there are a lot more in the gallery.
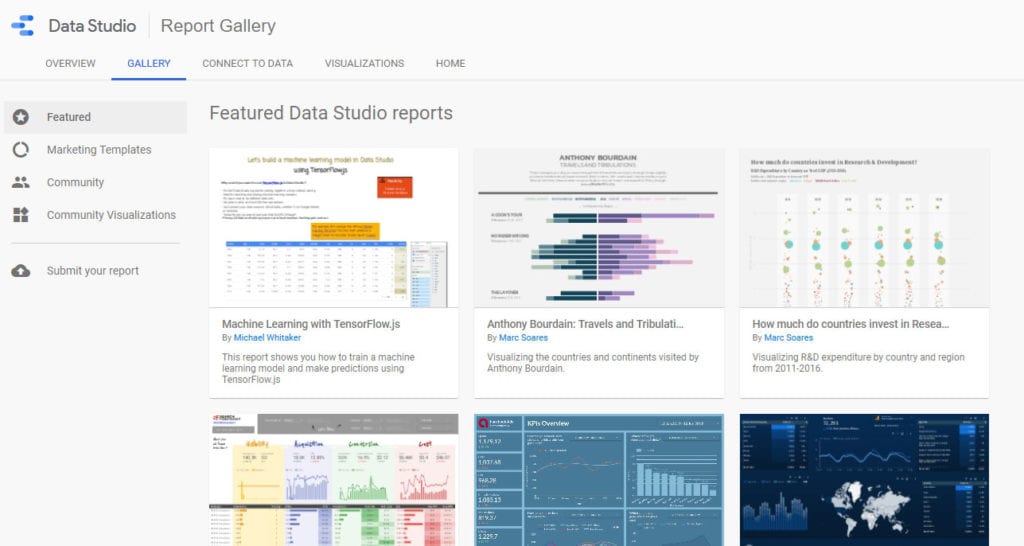
Here, like custom dashboards for Google Analytics, you find templates made by Google developers as well as the user community. Have a look around, there is also some fun stuff like a report that shows the live position of the international space station.
In addition, you can also publish your own reports. However, make sure not to include any sensitive information. Instructions here.
Create Your Own Report Themes
You have already seen some of the styling abilities above. However, Google Data Studio can do a lot more than that.
To find out about it, click Theme and layout on the report screen. This gives you access to a number of ready-made themes.
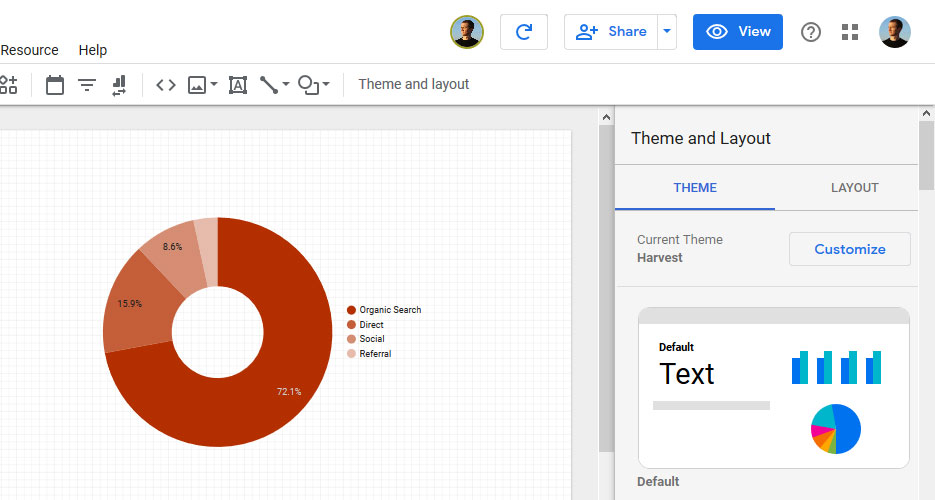
When you click Customize at the top, you get options for changing fonts, colors, and other styling options. GDS will automatically apply any changes you make here throughout the report.
You can also include your or your clients’ logo via Insert > Image. This way, you can make the reports fit the intended organization and generally make them look more professional.
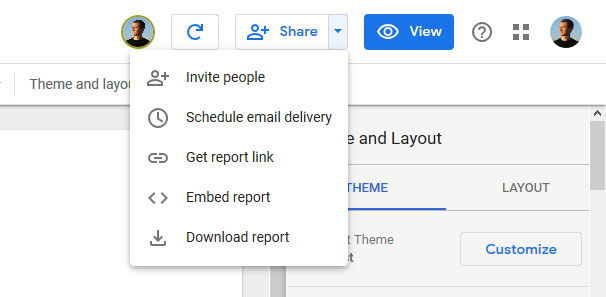
Schedule, Download, Embed Reports
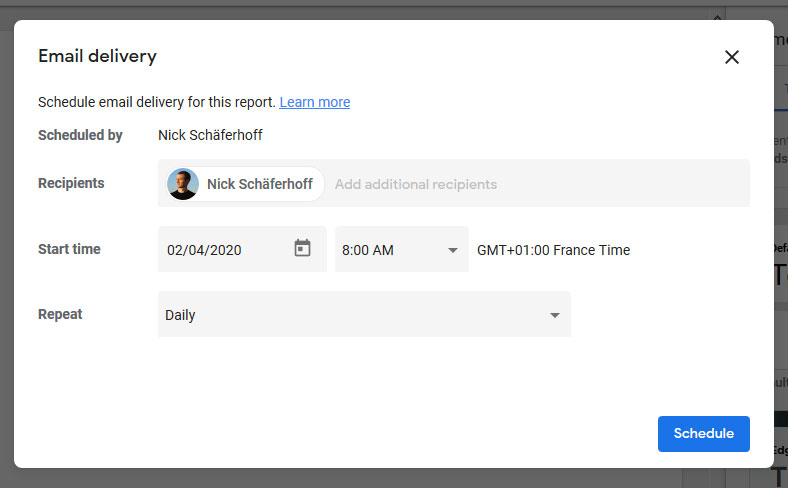
In reporting, it can often make sense to get periodical updates. This is especially true when working for/with clients. If that is the case for your report, you can use Scheduled email delivery under the Share options.
Click the menu item, enter the email addresses of those supposed to receive the report, set a start time and schedule and you are good to go.
In the same menu as before, you can also download the report as a PDF if needed. This includes the option to export the entire report, download certain pages (and their order), and even password protect it.
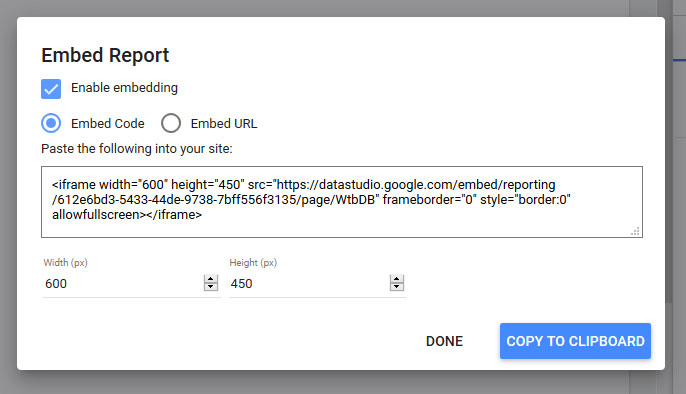
Finally, you can embed reports with the little bracket icon. It will give you a popup with a configurable embed code. Copy and paste it where you want it to show.
There is a lot more that you can do with GDS. To learn more advanced techniques, check out the posts here and here. There’s also the official documentation.
Google Data Studio in a Nutshell
Google offers many tools to track and visualize website data. Besides the usual candidates, GDS offers a way of combining data from many sources, from your website to peripheral marketing measures.
It can be a bit complex but once you have the basics down, you are able to built whatever report you want and make it look to your liking. It’s a very useful tool both for solopreneurs, teams, and those having to report to clients or higher-ups.
By now we are both smarter about what the tool can do. In the end, that’s what this Google Data Studio tutorial was about, wasn’t it? I feel better about myself already, how about you?
What’s your favorite Google Data Studio feature? Let us know in the comments section below!
The post Google Data Studio Tutorial – Basics, Beginner Tips, Next Steps appeared first on Torque.
