As a site owner, it’s important that you learn how to speed test your website. Page loading speed influences many things, from user experience over conversions to SEO. That’s why we have already covered how to improve it in these posts:
- 14 Ways To Speed Up WordPress And Decrease Page Load Time
- 10 Easy Ways to Speed Up Your WordPress Website [Case Study]
However, the basis of putting any of these tips into action is that you have a proper understanding of the current state of your site. While there are many software solutions to test site speed out there you also need to be able to understand and interpret the results. Only then can you take steps to correct problems.
In this post, you will learn exactly that. Below, we will discuss in depth how to speed test your WordPress site. We will go over the loading process of web pages, examine important speed metrics and list tools to test them. After that, the post will discuss how to acquire meaningful data from that and what to do with the results.
Learning this will allow you to take the correct measures to make your site load fast and be of better service to your audience.
Website Speed Optimization – First Steps
Before getting into how to speed test your site, it makes sense to cover important concepts and tools in this area.
How a Webpage Loads
A basic thing to understand is how a web page ends up in front of a visitor. Knowing this will help you better understand where issues may arise and thus correct them.
First, the user opens a browser and puts in a web address. This creates a DNS request that resolves into the domain name provider, which points to a server. From there, the browser starts loading the files that make up your site:
- HTML — Provides the main structure of your site. If you are using WordPress, the CMS dynamically produces it from PHP. The HTML document also includes calls to all following file types.
- CSS — Responsible for styling, colors, dimensions, and more. Found in style sheets.
- JavaScript — Mostly adds interactive elements and functionality to your site. Whenever something moves, it is often thanks to JavaScript.
- Assets — Other files that provide parts of your site. The most common here are usually images.
- External resources — Not everything that goes into your site lies on your own server. Some elements (like custom fonts) come from external sources.
Once the browser receives the files, it can start building and then rendering the content. The order and speed in which it receives files determine how fast visitors can see changes in their browser window. For a more detailed breakdown of how this works, check this article.
What’s important to note is that all of the above represent different HTTP requests. Having too many of them can already cause a slowdown. If you suspect that is the case, the linked post will tell you how to deal with it.
Important Speed Metrics
In addition to the above, in order to troubleshoot speed issues on your website, it’s good if you understand some basic metrics that influence the user experience while loading a page.

- Time to first byte (TTFB) — Amount of time it takes for a browser to receive the first information from the site.
- First paint — The moment the screen is no longer blank. For example, a background color change counts as first paint.
- First contentful paint — When the first content appears. Might be part of the navigation, header image or any other element.
- First meaningful paint — Here, users are able to see the primary content so that they can understand what the page is about.
- Time to interactive — The duration until the page is usable and you can interact with it.
Many of the tools below will show you exactly this type of information.

Each step depends on different factors and thus needs different solutions when there is a problem. For example, if the time to first byte is very long, it’s often an indicator for a slow server. Thus, knowing the steps will help you pick up on where the process stalls and take targeted action.
Site Speed Testing Tools
Below are a number of tools you can use to test your site. They will give you different sets of data to understand how it is faring. Further below, we will discuss what to do with this data.
- Lighthouse — A chrome extension that you can use to generate reports on any website’s accessibility, SEO, best practices, and performance. It’s able to simulate a mobile connection, uses many of the metrics above and gives recommendations on how to improve your site.
- PageSpeed Insights — I have recommended this tool many times in other posts. It now comes with data from the Chrome User Experience Report, at least for popular sites. Aside from that, the service provides similar data as the Lighthouse extension.
- Test Your Mobile Speed — A Google testing tool specifically for mobile speed. Allows you to simulate different locations and connection speeds, compare the results with competitors, evaluate the potential business impact of improving your loading speed and get tailored recommendations for different pages. You can also get a detailed report emailed to you.
- Pingdom — The first non-Google tool for speed testing. Pingdom will give you a lot of the same information as PageSpeed Insights, however, in my opinion, easier to digest and understand. For example, it comes with a waterfall diagram to spot bottlenecks and has other information.
- GTmetrix — Similar to Pingdom but with even more data. Can be a bit more overwhelming and less user-friendly but gives you a lot of information to work with.
In addition to the above, there are two other sources of information on how visitors see your site. The first is located in Google Search Console under Crawl > Crawl Stats.

Here, you can see the response time for when Google accesses your site. If the average is above 500ms, it’s time to take action
The second tool is the speed reports in your Google Analytics (find them under Behavior > Site Speed).
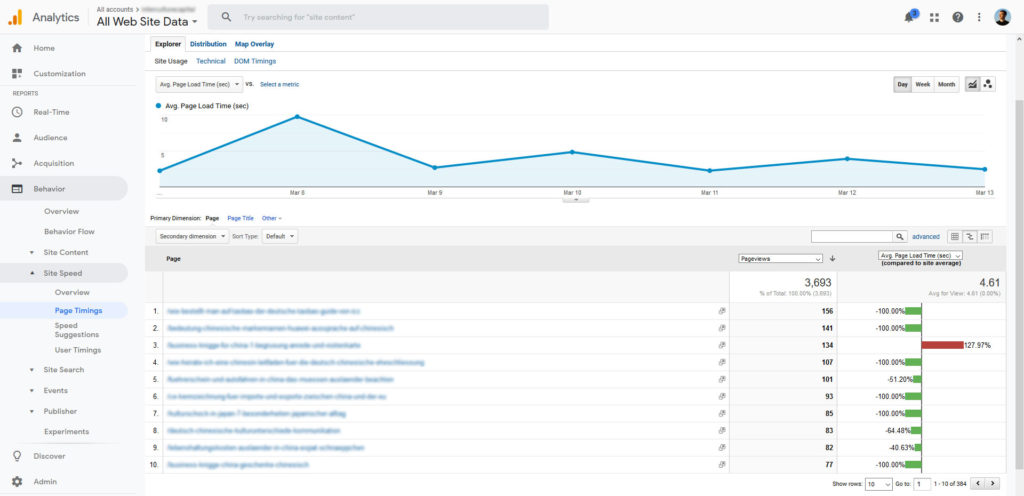
Here, you get information about the page loading speed for different browsers and pages as well as suggestions for improvement. Be aware, that, by default, Google Analytics will only track this for 1 percent of your pages. To get more information, increase this number to 50 or 100 percent.
So, How Do You Use This to Speed Test Your Website Then?
Alright, now that you know what to look for and how to track it, here’s how you can you use the above information to test the speed of your website.
1. Test Your Homepage
A site’s front page often gets a large share of traffic. It’s also your site’s figurehead. For that reason, this page is one of the first things you should test. Doing so will also give you information about how your site fares in general.
Therefore, feel free to plug your homepage into one or more of the speed testing tools above. However, when you input the URL somewhere, it’s a good idea to add a cache buster parameter to it like so: https://yoursite.com/?cache=busted. That way, it doesn’t use any pre-loaded assets and you get closer to the experience that a first-time visitors would have.
If this makes a huge difference on your page, it might mean that you are relying too much on caching for speeding up your site. In that case, you should take action to make the experience better for those coming to your site for the first time. For repeat tests, add numbers to the end of the parameter (e.g. https://yoursite.com/?cache=busted2), otherwise, you might get cached results again.
2. Take Multiple Tests From Multiple Locations
Your site speed will be different depending on the time of day and location from which people access it. Thus, to get a more accurate reading about its situation, it’s best to take several measurements.
Ideally, you should schedule automatic tests every hour and let them run for a week. You can set up monitoring like this with GTmetrix and Pingdom but it’s not free. So, if that’s not something you want to pay for, at least do a number of manual tests at different times.
In addition to that, it makes sense to try several locations. You can use the same tools to do so, just note that you have to register for a (free) GTmetrix account to enable switching locations there.
Here, it’s important that you test according to your audience. If you have a local site (for example, one that is only available in your home country’s language), using the closest location to your server is enough. However, if you target an international audience, it makes sense to see what the experience is like for visitors from different locations.
3. Test Your Most Important Pages
At this point, you need to be aware that there is a difference between site speed and page speed. Site speed is the sum of the loading speed of all pages on your site. Page speed is how fast singular pages on it load.
For that reason, it’s not enough to simply test the front page of your website. This is especially important, since, in many cases, it is actually one of the least content-heavy pages you’ll have.
Theoretically, you should run tests on all of your pages, as most organic visitors do not come through the main address but random pages they find in search results. It’s possible to do so with crawlers, for example, Sitebulb or Screaming Frog (both paid products).
If you are not using those, depending on the size of your site, testing all pages isn’t all that practical. In that case, you should check at least your most important pages. You can find those via your analytics band Behavior > Site Content > Landing Pages.
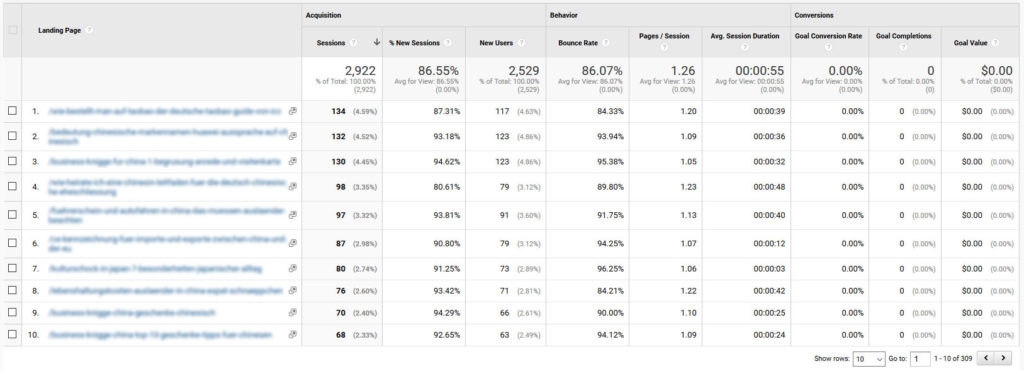
These are the parts of your site that visitors mainly use to enter it. When you set yourself a goal to optimize at least the top 20 results, you already have your work cut out for you.
In addition, you might want to check the aforementioned page timings and order them by average page load time to find the worst offenders.
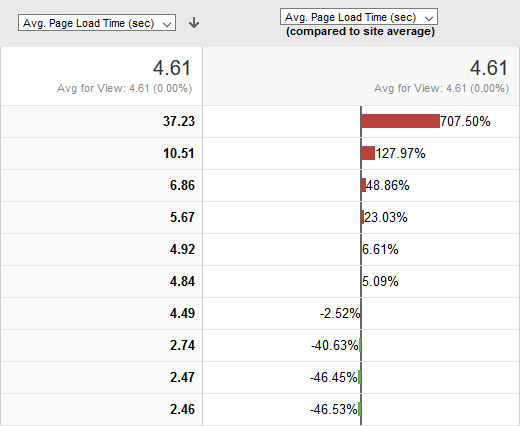
Put those on your list of pages to optimize as well. Also, come back here after you have optimized your site as the average will change and there will be a new set of slowest pages.
4. Now Do the Same for Your Competition
After figuring out how your own site is faring in the above areas, if you still have energy, you might want to engage in some competitor analysis. That means, taking a handful of your closest competitors (business wise or in the search results) and put them through the same process.
Why?
Because speed might be something that you can beat them at. Studies have shown that people are likely to go to a competitor website if their first choice takes too long.
In addition to that, page loading speed might be the thing that puts you above your competitors in the SERPs. Since the majority of clicks go to the top Google results, that can never be a bad thing. For that reason, don’t forget to speed test the competition.
How to Use the Speed Test Results
Alright, by now you should possess a lot of information about your site’s speed profile. Now is the question, what do you do with it? Let’s talk about that quickly.
Focus on Real-Life Improvements
While many of the speed testing tools give you ratings and percentages, it’s important that you don’t concentrate on these scores. It’s possible to have a lot of green lights but still provide an abysmal user experience.
Instead, focus on what your visitors really care about: how many seconds it takes to load your pages. If you can improve that, it will make the most impact and also automatically lead to better scores. So, forget about the feel-good metrics and concentrate on producing real-life results.
How to do that? I’m glad you asked.
Fix Sitewide Problems First
When trying to speed up your WordPress website, it’s best to first focus on factors that affect all parts of it. By fixing general shortcomings, you can improve the page loading speed of all pages at once. Doing so will make the biggest difference for the largest share of visitors.
Examples of measures you can take in this area include:
- Changing your hosting provider
- Updating your PHP version
- Cleaning up your database
- Cleaning up your site
- Enabling Gzip compression
- Optimizing Images
All of this will affect your site as a whole, leading to great improvements.
After That, Focus on Single Pages
When you have taken measures to improve your site in general, you can then go ahead and deal with single pages. If your tests showed that some of the most important ones have bigger problems, it’s time to dive into the waterfall diagram and find out who is the culprit.
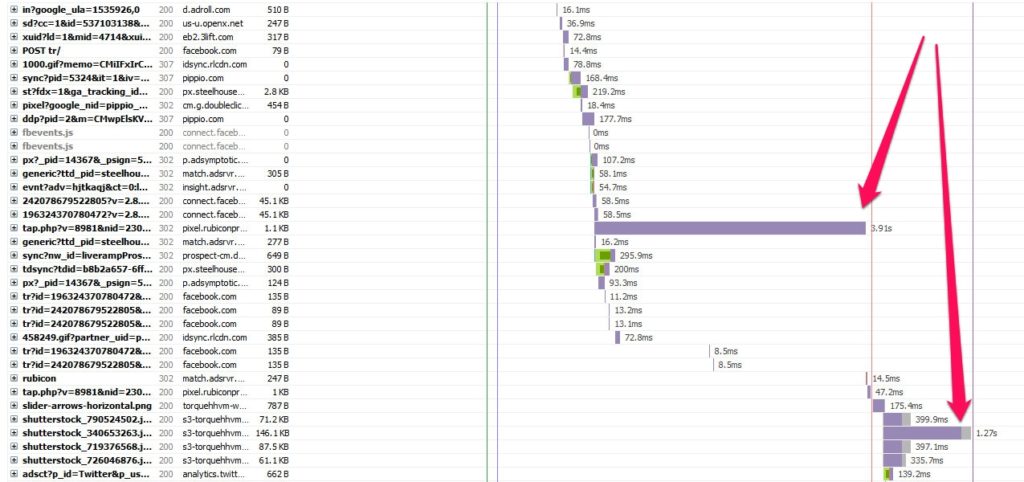
It could be an image that is too large, a remote script that would be better off hosted locally or any other of the many files that go into a page. Each instance is different, therefore, the solutions will vary. Improve one page after the other in the order of importance and you will make a big difference in the end.
Final Thoughts on How to Speed Test Your Website
Learning how to test your website for loading speed is a helpful skill in creating better, more user-friendly sites. The influence of page loading speed on website success is something many people underestimate. Only having proper data will allow you to take the right action in this area.
Above, you have gotten a first-rate education on performing a speed test on your WordPress site. You have learned what goes into loading a web page, important metrics for page loading speed and tools to measure them. You now also know how to apply that knowledge to your own site to make it faster.
The above should be enough to give your website a significant speed bump. When you do that, chances are good that it will improve the rest of your success metrics as well.
How do you speed test your website? Any additional comments, tips or tools to share? Please do so in the comments section below.
The post How to Speed Test Your Website (Metrics, Tools, Optimization Tips) appeared first on Torque.
