In case you haven’t noticed it yet, here at TorqueMag we are a little obsessed with web analytics. You can see it from articles like these:
- 10 Excellent Google Analytics Alternatives You Should Check Out (2019)
- The 4 Best Google Analytics Plugins For WordPress
- A Google Analytics Tutorial For Beginners And WordPress Users
Why do we stress this point to so much? Because knowing what is going on with your site traffic is the first step in optimizing your web presence for it. Or as Sherlock Holmes puts it:
It is a capital mistake to theorize before one has data. Insensibly one begins to twist facts to suit theories, instead of theories to suit facts.
In other words, having access to and analyzing your data is an essential part of making informed decisions about your site.
In this post, we want to talk about a tool that helps you cut through the noise and focus on the data that really matters: custom Google Analytics dashboards.
If you want to know what they are, why you should use them and most importantly, how to implement custom dashboards in Google Analytics, just keep reading.
What are Google Analytics Dashboards?
We can’t possibly discuss how to customize dashboards until we cover what they are in the first place. Here’s how Google defines them:
Dashboards are a collection of widgets that give you an overview of the reports and metrics you care about most. Dashboards let you monitor many metrics at once, so you can quickly check the health of your accounts or see correlations between different reports.
In short, your dashboards give you an overview of your website data.
What kind of data?
Well, all of it. For example, your dashboard can give you more information on how many new visitors you’ve had on your site, the average duration of their visits, and how many of them accessed your blog through mobile devices.
Armed with this information, you are able to tweak your site to ensure that it serves your audience well. Plus, tells you all of this out of the box without you having to do anything.
Why Create a Custom Dashboard?
While the above sounds great, it can also be overwhelming. Google provides a lot of data. In fact, it knows over 500 unique dimensions and metrics.
While this can help you drill down to the most relevant information, you really need to filter it to do so. Data is only good once you can understand it in a meaningful way.
For instance, if you run a PPC campaign and have a couple of landing pages, you’ll be curious about how they perform. That means, besides the conversion rates for each landing page you might also want information on your visitors’ country of origin, bounce rates, referral paths, etc.
While Google Analytics provides this kind of data, you often have to click through several different menus to find it. However, with a custom dashboard, you are able to combine it all in one place. That way, you know the state of your campaign at a single glance.
Sounds good? Then let’s get to the how-to part.
Creating a Custom Google Analytics Dashboard Step by Step
Creating your own dashboard is a fairly easy process. However, the most important part is that you know beforehand what you’re trying to track. What are your main objectives? This will tell you which widgets and metrics to add later on.
1. Set Up a New Dashboard
After logging into your Google Analytics account, go to Customization > Dashboards. In the menu that opens up, hit the red Create button.
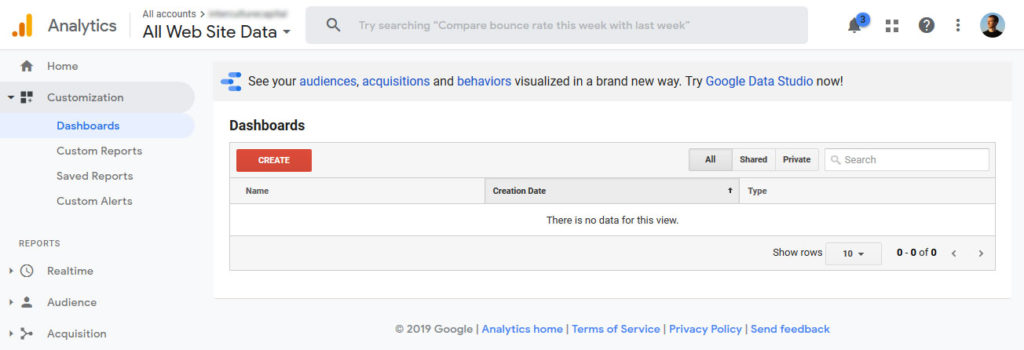
This will prompt a popup with two options: Starter Dashboard and Blank Canvas.
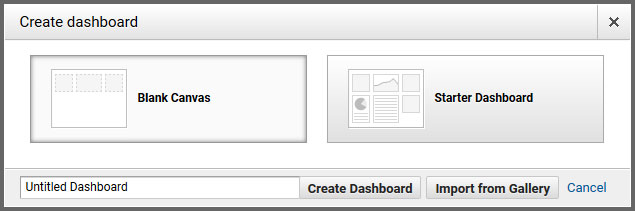
A Starter Dashboard will come with a pre-set number of useful widgets such as bounce rate, average session duration, and pages/session.
For this tutorial, we will use the Blank Canvas option. As the name suggests, it is completely empty, making you free to include whichever widgets and metrics you like.
After making your choice, be sure to input a name for the dashboard. It’s best to make it something descriptive so you understand what it shows later on. Then click on Create Dashboard.
If you get a popup to create widgets, close it for now, we will talk about that soon. Doing so gets you here:
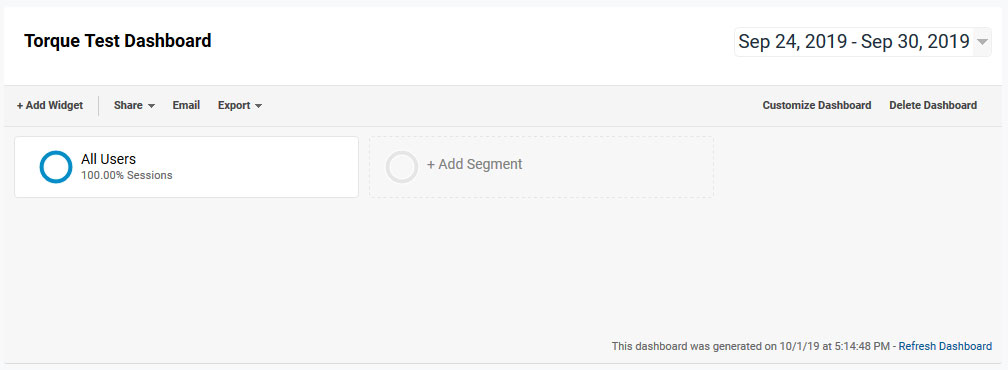
2. Add Segments
Any custom dashboard that you create will automatically apply to all visitors on your site. However, at the top, you can also limit it to subsegments of your audience or include additional user segments.
Simply click on Add Segment to get to this list:
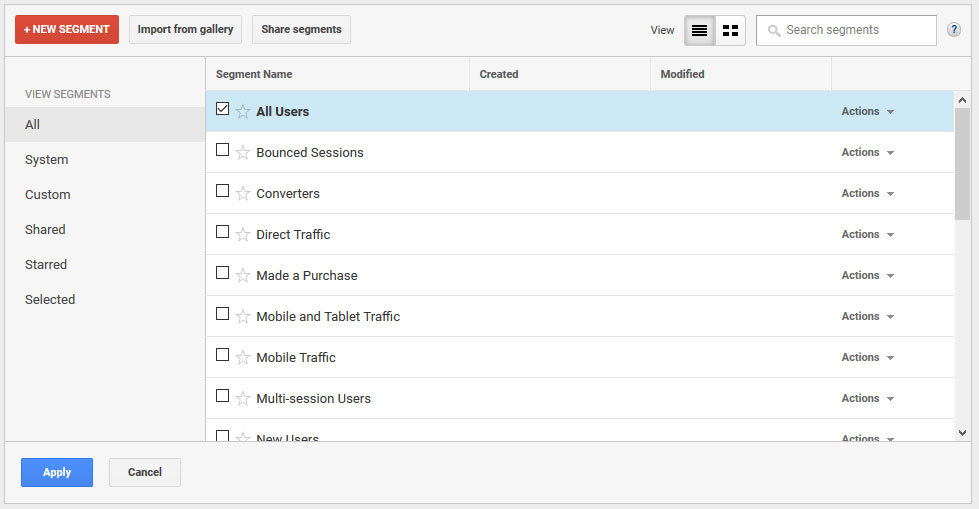
Here, check the boxes for any segments present in your Google Analytics account, create new segments, or import existing ones from the Solution Gallery (more on that soon).
Once you have made a choice and clicked Apply, your choices will then appear at the top of the dashboard.
You will also find information about every segment in each of the widgets present on the dashboard. Learn how to create those now.
3. Choose Your Widgets
After this, it’s time to start adding widgets. You can do so via the Add Widget button in the top left.
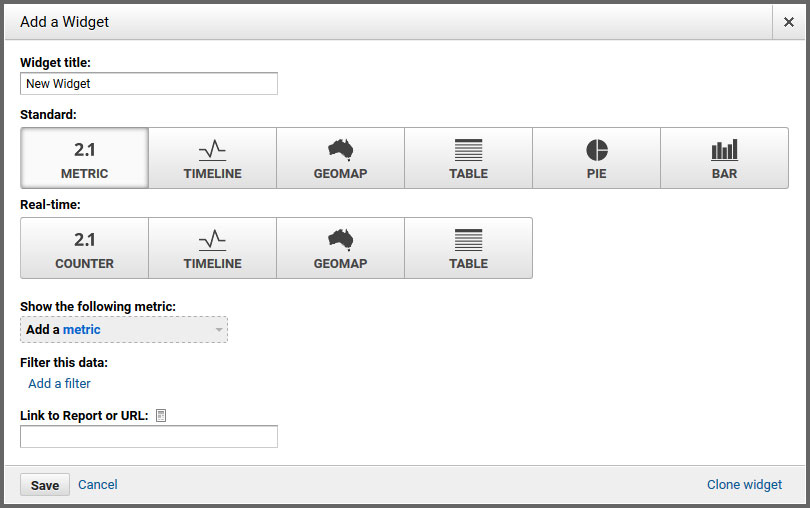
You can choose from six different format options, four of which are able to display website data in real-time (otherwise, metrics are only updated upon load or refresh). Here’s what they mean:
- Metric – Here you will see your data as a number.
- Timeline – This widget allows the information to be shown over a certain period of time. You can also compare it with another metric.
- Geomap – Allows you to view data according to regions. You can select a specific locale you’re particularly interested in.
- Table – This will show your data in a table.
- Pie – Generates a pie chart of the information you are tracking.
- Bar – Same as above only using a bar graph.
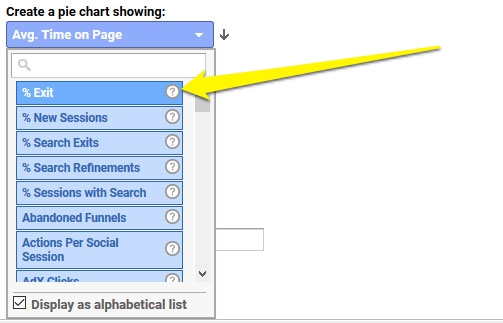
Once you have made your choice, under Show the following metric, you’ll also need to specify which information you’re interested in monitoring. This can be anything from new sessions over click-through rate to time on page and more.
To help you decide on the specific metric you’d like your widget to monitor, hover your mouse over the question mark next to it. This will give you an explanation of what each of them means.
4. Filter the Data and Finalize
Once you have picked the metric you want to track, the option to filter it appears.
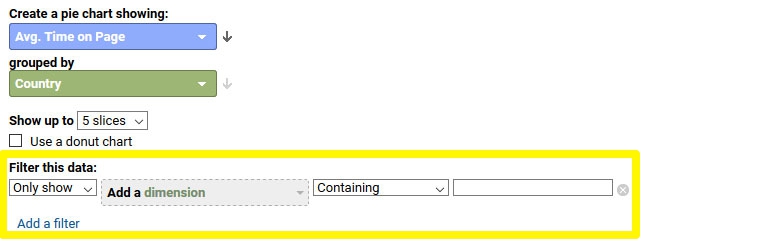
When you click Add a filter, you get the following options:
- Only show/Don’t show — Display only certain dimensions of data or filter out parts of it.
- Add a dimension — Here, you can pick parts of a metric to include/exclude in the report. As before, you can hover over the question marks to see what the dimensions mean.
- Containing/Exactly matching/Regular Expression/Begins With/Ends With — Here, you are able to fine-tune your results.
At the bottom, you are also able to include a link to your Google Analytics report or URL. Simply start typing the name of the report you want to link this to and you will receive suggestions from which you can pick.
When you’re happy with your choices, hit Save and your widget will appear on the dashboard.
By the way, you can create up to 20 dashboards and each dashboard can have up to twelve widgets. Just in case you were afraid of running out of space.
5. Editing Widgets
In case you find yourself wanting to make changes to existing widgets, this is as easy as creating them. Simply hover over one and click on the pen icon that appears.
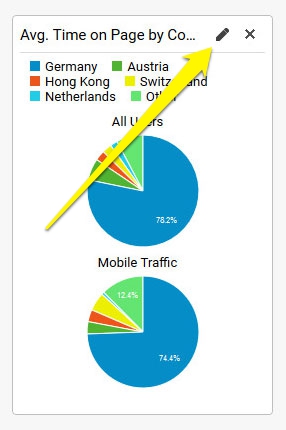
You can then make any change you want.
You are also able to use the Clone widget link in the lower right to duplicate an existing widget and create something similar.
Finally, a click on Delete widget removes it from your custom dashboard. You can achieve the same by hovering over it, clicking the small x, and confirming.
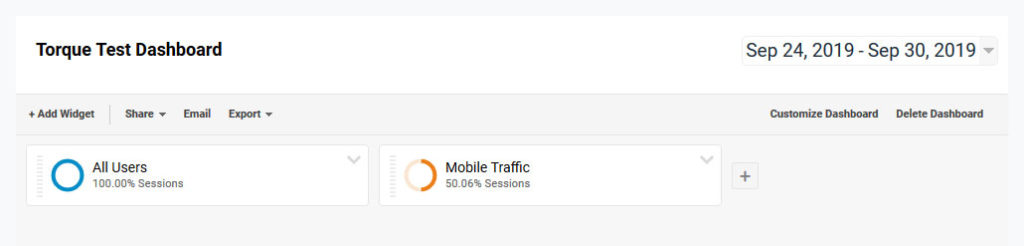
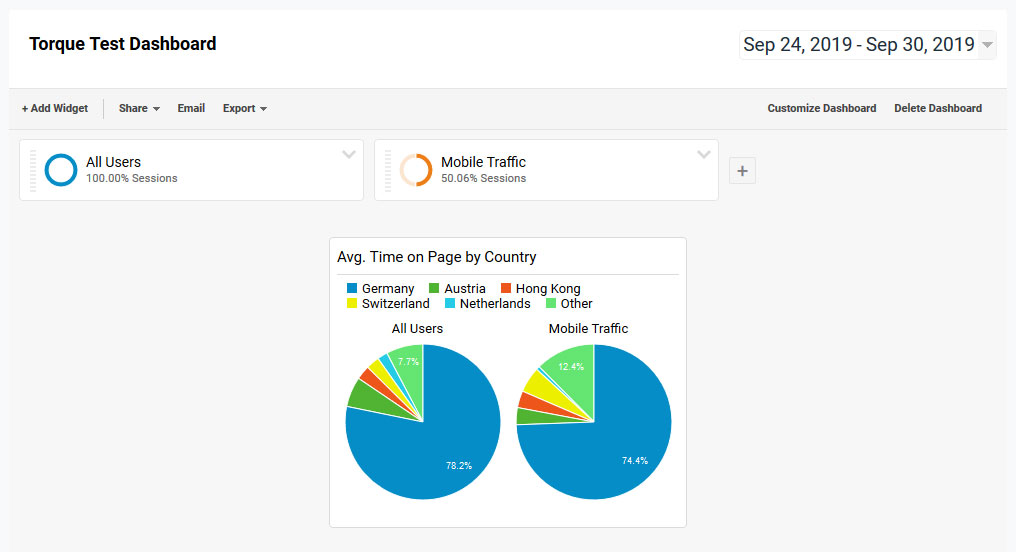
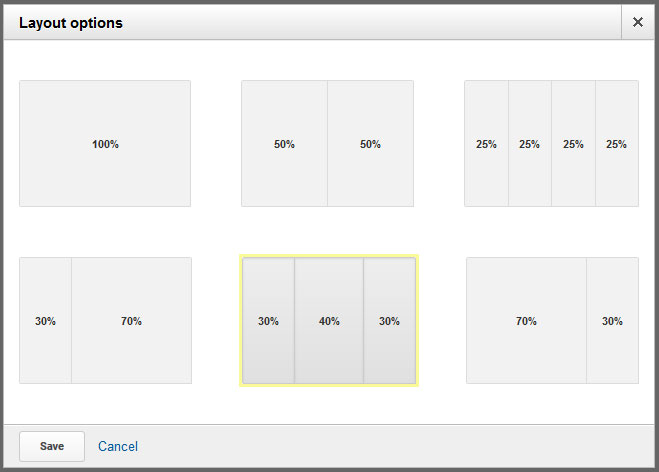
6. Customize the Dashboard
If you are not satisfied with how the widgets are arranged, no problem. In the upper right corner, you may click on Customize Dashboard to choose different layout options.
In addition, when you hover over the title section of any widget, this allows you to drag and drop it to another position.
Finally, just like in many other places of Google Analytics, you can set a date range for which you want to see data in the upper right corner. This allows you to see information for a set time period and also compare it with another time frame to spot changes.
7. Sharing or Exporting Dashboards
Once you’re done, you can also share and/or export your dashboards.
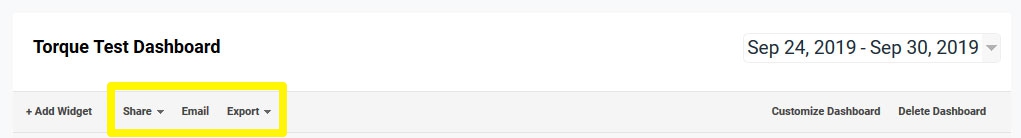
For that, you have several options:
- Share a copy of the dashboard with someone else on your team. That way, they will be able to see the data and customize their copy of the board and its widgets to their liking. You can do this via Share > Share Object. To unshare the dashboard, you must delete it.
- Via Share > Share template link, you can make the dashboard setup available to other users. They won’t see your data but can use what you have created for their own site.
- Another option is to make your dashboard available in the Solutions Gallery (Share > Share in Solutions Gallery). From here, anyone can import it to their own account. More on that below (yes, I know I have said that before).
- The Email button lets you send a PDF of the current data on your dashboard to any email account. You can also set it to automatically do so at regular intervals as a way of reporting what’s going on on the site.
- Via Export > PDF, you may download the same PDF to your local machine.
8. Deleting Custom Google Analytics Dashboards
Finally, should you ever find yourself in the position that you no longer need your custom dashboard, you can get rid of it via the Delete Dashboard button in the top right corner.
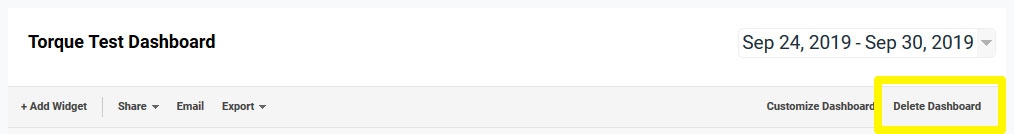
When you click it, a prompt will ask if you are serious. Once you confirm, it’s gone.
Importing Existing Custom Dashboards
If you’re not too keen on creating your own custom Google Analytics dashboard, you also have the option to import existing templates. It can save you time and it might also be useful to see how others have organized their information.
1. Find Existing Dashboards
We already mentioned the Solutions Gallery further above. It contains a number of custom dashboards that other users have created.
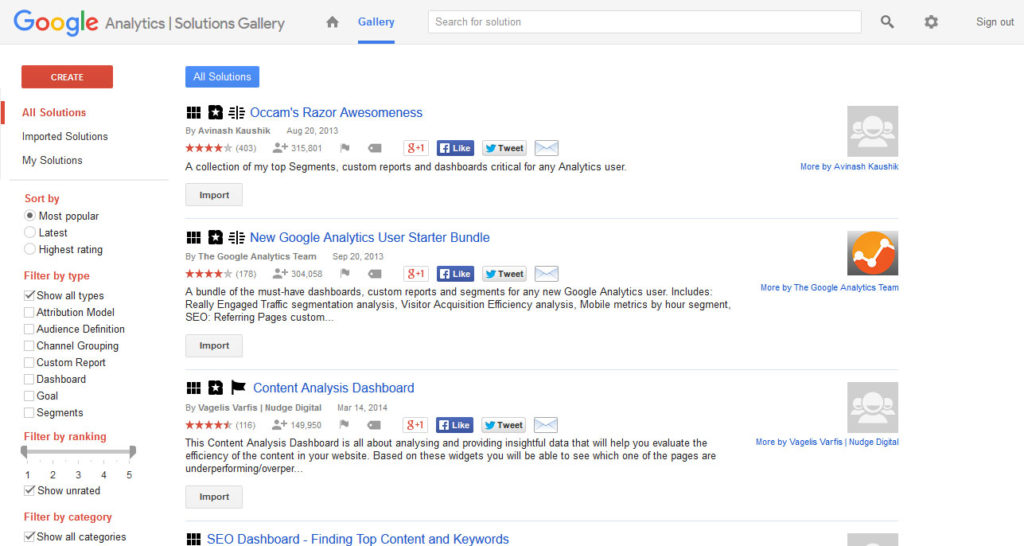
For example, the Audience Snapshot Dashboard focuses on your visitors’ demographics, devices, and locations, while the SEO Dashboard helps you find your top-performing content and keywords.
Entries are also rated by users and categorized. You can sort and filter them on the left. Click on any of the entries to learn more about them. This will help you find the right custom Google Analytics dashboard more easily.
2. Import Them Into Google Analytics
To import any of the available dashboards to your own analytics account, simply click the Import button in the list or on the dashboard’s page. This will open the following window.
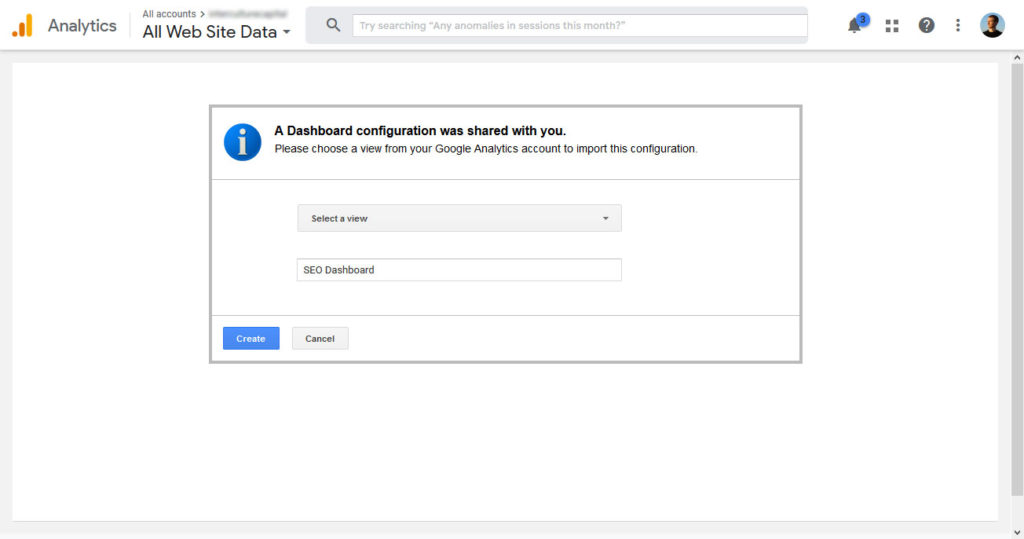
Use the drop-down menu where it says Select a View to pick which view to assign the dashboard to. Below that, you can use the checkmarks to determine which segments, custom reports, and dashboards present in the solution want to import. There’s only one in this example but you might find more options depending on your pick.
When you have made your choices, click Create. After that, you will find any dashboard that you imported in the same place as the rest of your custom Google Analytics dashboards. Of course, once there, you can customize it further as described above.
Summing Up: Custom Google Analytics Dashboards
Having accurate data about the state of your website is crucial to make decisions about it. Web analytics such as those made by Google goes a long way in understanding what is happening under the hood.
Custom Google Analytics dashboards help make this information more accessible by allowing you to determine what’s most important for you to know – and then putting it all in one place.
As you have hopefully seen above, setting up your own custom dashboard is easy to do. In addition, you can share your work with others and also import other people’s configurations.
Doing so allows you to track your website more easily and improve it accordingly. From now on, you simply don’t have an excuse for not taking full advantage of Google Analytics anymore.
Have you created a custom dashboard for yourself? What’s your must-track data on there and why? Let us know in the comments section below!
The post Custom Google Analytics Dashboards – Why and How to Create Them appeared first on Torque.
